
Stat tracking is accurate enough to trust for most competitive decisions, but the honest answer depends on the technology behind the numbers and whether you're measuring a player or a ball. A radar-based positioning system can land within a few centimeters of the real position, while GPS can be off by close to a meter. The comparison below breaks down why.
TL;DR:
- Low sampling rates and smoothing flatten peak speed and acceleration; sprint speed needs more frequent sampling than total distance, so check rates against your intended metric.
- For coaching or rankings, require validation against a recognized reference and save exports; consumer trackers suit trend watching, but KPIs from different systems are not comparable.
Table of Contents
- How tracking technologies compare in spatial and kinematic accuracy
- Why occlusion, ID swaps, and sampling rate distort your numbers
- Reading validation studies: RMSE, vRMSE, and percent deviation
- A practical checklist for evaluating any stat-tracking tool
- How Droidex Companion approaches reliable tracking for Droid Tycoon
- When validated trackers matter and when consumer tools are fine
- Where to try Droidex Companion and check its accuracy safeguards
- FAQ
- Sources
How tracking technologies compare in spatial and kinematic accuracy
Not every tracking system measures the same way, and the differences show up directly in the error margins. Validation research comparing athlete positioning methods against a motion-capture reference found radar-based local positioning systems (LPS) produced a pooled distance error of about 23 centimeters, while video-based optical tracking landed near 56 centimeters and GPS trailed at roughly 96 centimeters, according to validation research on player tracking. That gap matters for anyone using raw distance or speed numbers to compare players or seasons.
The pooled error spread between LPS, video, and GPS tracking spans roughly 23 to 96 centimeters, according to validation research on player tracking, meaning the system behind a stat line can shift a measurement by nearly a meter before you even account for in-game conditions.
- LPS tends to perform best because radar sampling is less dependent on lighting or camera angle.
- Video-based optical systems lose some precision when players cluster or move behind each other.
- GPS lags behind both because satellite signal quality varies with stadium structure and sampling rate.
Ball tracking carries its own, separate error profile. Balls move faster, accelerate harder, and occupy less visual area than a player, which strains sensor placement and camera resolution. Multi-camera architectures reduce this gap somewhat by cross-referencing angles, which cuts down on the occlusions and identity swaps that single-view systems struggle with.
Why occlusion, ID swaps, and sampling rate distort your numbers

Most tracking errors trace back to a handful of repeatable failure modes rather than random noise. Occlusion happens when one player or object blocks the camera's view of another, forcing the system to estimate a position until it regains a clear line of sight. Identity swaps follow a similar pattern: once a tracker loses a player behind an occlusion, it can reassign that player's path to a different jersey number, and that single mistake quietly corrupts every downstream metric tied to that identity for the rest of the session.
Sampling frequency changes the picture too. A tracker recording at a low frame rate smooths out sharp accelerations, which understates peak speed and peak acceleration even when average distance covered stays close to accurate.
- Lower sampling rates flatten peak speed and acceleration readings.
- Smoothing algorithms trade short-term precision for a cleaner-looking curve.
- Ball-specific issues like spin and vertical (Z-axis) drift add error on top of player-tracking noise.
Pro Tip: Check whether a tracker reports its sampling rate before trusting any peak-speed or peak-acceleration figure it produces.
Reading validation studies: RMSE, vRMSE, and percent deviation
Validation studies lean on a few recurring metrics, and knowing what they mean turns a dense research paper into something you can actually use. RMSE, or root-mean-square error, measures how far a tracked position typically sits from the true position, expressed in meters. Percent deviation does the same job for a specific statistic, showing how far a tracked value strays from a known reference as a share of that value.
A positional RMSE near eight to nine centimeters, reported for a leading optical tracking system against a motion-capture reference, is small enough that most game-level distance and speed metrics hold up, with key performance indicator deviations commonly under half a percent, according to validation research on TRACAB's optical tracking.
- RMSE translates roughly to "how many centimeters off is this position, on average."
- Percent deviation shows the practical size of that error against a real KPI.
- Published figures can look better than real-world performance when a study excludes dropped frames or edge cases.
A practical checklist for evaluating any stat-tracking tool
Before you lean on a tracker for coaching decisions, league rankings, or competitive bragging rights, run through a short set of checks.
- Ask whether the tool publishes a validation comparison against a motion-capture or other recognized reference.
- Confirm the sampling rate and whether it's high enough for the metric you care about (sprint speed needs more frequent sampling than total distance).
- Check how the system handles identity swaps and occlusions, and whether it flags uncertain frames.
- Look for the ball-tracking method specifically, since it typically carries more error than player tracking.
- Verify the data is exportable so you can run your own spot-checks against a recorded session.
- Note the last refresh date on the underlying dataset or model.
- Ask whether a manual correction to one stat propagates into every metric derived from it, since some systems leave derived numbers stale after an edit.
Pro Tip: Record one short session yourself and compare the tracker's output against a manual frame-by-frame count before trusting it for anything competitive.
The tolerance you need shifts with the stakes: a casual leaderboard can absorb more noise than a coaching decision tied to playing time or a comparison used to settle a ranking dispute.
How Droidex Companion approaches reliable tracking for Droid Tycoon
We built our app around local screen recognition rather than cloud-based processing, which removes the upload and OCR latency that can introduce lag-related errors in live tracking. That local approach lets us monitor in-game stats, rebirth timers, and collection progress as they happen, with overlays you can customize to show what matters during a session.
- We process everything on-device, so there's no round trip to a remote server before a stat updates.
- We provide a step-by-step 5-minute setup guide for configuring screen recognition and overlays.
- We support a competitive leaderboard system, and we outline fair verification practices in our leaderboard etiquette guide.
Local processing reduces one class of error without claiming to eliminate every source of tracking noise inherent to screen recognition.
When validated trackers matter and when consumer tools are fine
For coaching decisions, player evaluations, or anything with money or standings attached, lean on trackers with a published validation comparison against a recognized reference. For everyday trend-watching, a consumer tracker without that paper trail is fine as long as you treat the numbers as directional. Save your exports and document your queries so you can reproduce a result later, and resist comparing KPIs generated by two different systems as if they were measured the same way.
— Daniel
Where to try Droidex Companion and check its accuracy safeguards
We keep every core feature of our app free, including live stat tracking, rebirth planning, and leaderboard access, so you can judge the accuracy for yourself without a purchase decision standing in the way.
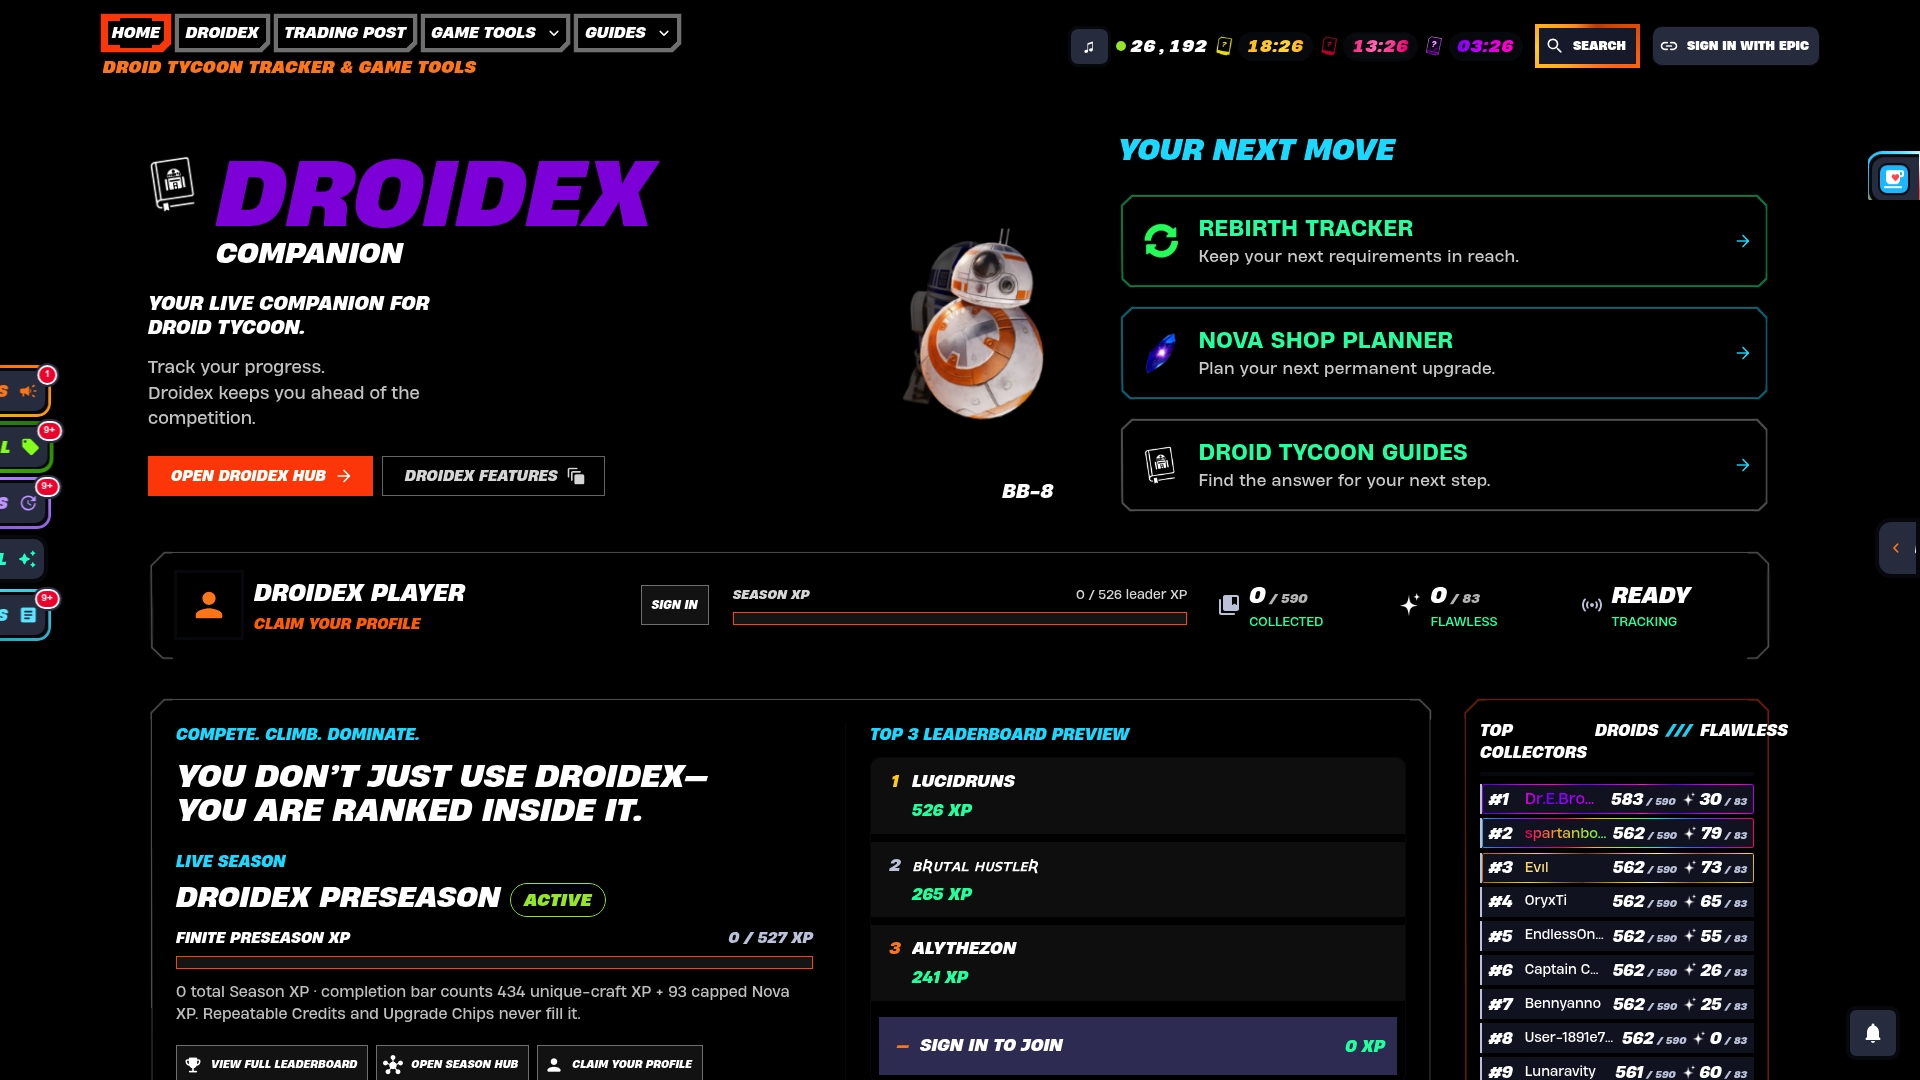
Start with the 5-minute setup guide to get overlays and screen recognition running, then review how we verify Droid Tycoon data if you want the technical detail behind our safeguards. From there, explore the Droid Tycoon tool pages for calculated metrics like base income and chip costs, or check community stats to see how your numbers stack up. Download the companion app from the Droidex Companion landing page and start tracking your next session.
FAQ
What is the best basketball stat app?
The right choice depends on your goal: official NCAA records suit Division I leaders and season totals, while tools built for per-possession or advanced metrics suit deeper analysis, according to a comparison of college basketball stat databases. Check coverage, whether figures are raw or adjusted, and how recently the data refreshed before relying on any single app.
Why is my stats tracking not accurate?
Inaccurate readings usually trace back to occlusion, identity swaps, a low sampling rate, or a tracking method poorly suited to fast-moving objects like a ball. Ball tracking typically involves 2D position errors of about fifteen centimeters and 3D impact-location errors reaching up to around twenty centimeters in stadium conditions, according to validation research on ball-tracking accuracy.
What is the most important statistic to track in basketball?
There's no single statistic that outranks the rest; the right one depends on whether you're evaluating a player, a team, or a game outcome. Official scorekeeping guidance from the NCAA basketball statistics manual focuses on recording only observed events accurately, which is the foundation every derived statistic depends on.
What are some good sports data apps?
Good options vary by sport and use case: some apps specialize in official league records, others in advanced per-possession metrics, and gaming-specific companions like Droidex Companion focus on live in-game tracking rather than professional sports. Match the app to your specific need, such as coaching, trend-watching, or casual competition, rather than picking one tool for every purpose.
Sources
- Validation of Player and Ball Tracking with a Local Positioning System
- Validation studies reporting ball-tracking error rates (2020-2021)
- Football-specific validity of TRACAB’s optical video tracking systems | PLOS One
- NCAA basketball statistics manual (2022-23)