
To get Droid Tycoon stats into a CSV file, log the values from the Player Stats screen into a spreadsheet at fixed moments, then save that sheet as a .csv file. A CSV is plain text with one row per snapshot and one column per stat, so any spreadsheet tool opens it. This guide gives the column layout, the logging schedule, the save steps and the checks that keep the file readable.
TL;DR
- The Player Stats screen shows credits per second, crit chance, time played, most crafted droid and rebirths. Those are the fields worth logging.
- One row per snapshot, one column per stat, one fixed logging moment per rebirth cycle. Consistency matters more than volume.
- Save the sheet as CSV (comma delimited) from Excel or Google Sheets, and keep one file per account.
- Droidex Companion reads your stats live with local screen recognition, so the numbers you log come from the screen without retyping from memory.
Table of Contents
- What you can log from Droid Tycoon
- Design the CSV before you log anything
- When to take a snapshot
- Step by step: from the Player Stats screen to a saved CSV
- Open and use the CSV to compare progress
- Problems with a CSV file and how to fix them
- Perspective
- Pair the file with live tracking
- Droidex Companion for your stat log
- Keep the log accurate over time
- FAQ
- Sources
What you can log from Droid Tycoon
The Player Stats screen is the source for every figure in your file. According to AllThingsHow, it lists credits per second, crit chance, time played, most crafted droid and rebirths. Each maps to a column type:
| Stat | Column type | Why it belongs in the file |
|---|---|---|
| Credits per second | Number | The main income measure, and the one you compare between cycles |
| Crit chance | Number (percent) | Shows whether upgrades changed your effective income |
| Time played | Duration | Turns raw income into a rate per hour of play |
| Most crafted droid | Text | Shows which droid your crafting loop leans on |
| Rebirths | Whole number | Marks the cycle each row belongs to |
A sixth column, the timestamp, is not on the screen but is the most useful column in the file. Without it, rows cannot be ordered or compared across sessions.
Two cautions on scope. The screen shows a point-in-time reading, so every row you record is a snapshot and never a running total that updates itself. Also, the values change with every upgrade and every rebirth, so a row is only comparable to another row taken at the same moment in the cycle.
Design the CSV before you log anything
Decide the columns once. Changing them later splits your history into two incompatible formats.
Recommended header row
Use this header in the first row of a new sheet:
timestamp,rebirths,credits_per_second,crit_chance_pct,time_played_hours,most_crafted_droid,note
Rules that keep the file clean:
- Use lowercase names with underscores. Spaces and capitals cause friction when you import the file into other tools.
- Store crit chance as a plain number such as 12.5 and put the unit in the column name. A percent sign turns the cell into text in some tools.
- Convert time played to decimal hours. A value like 14h 30m becomes 14.5, which sorts and averages correctly.
- Write the timestamp as year-month-day, then 24-hour time, for example 2026-11-08 19:40. This format sorts correctly as text and as a date.
- Keep the note column for events: a new upgrade, a patch day, a rebirth. Notes explain jumps that the numbers cannot.
Handling large numbers
Credits per second can grow into abbreviated values in the game display. Record the number the way the screen shows it, then add a second column with the full numeric value if you plan to chart it. Never put a thousands separator inside a CSV cell, because the comma splits the value into two columns.
When to take a snapshot
The value of the file comes from comparing like with like. Pick fixed moments and keep them for every cycle.
| Moment | What it tells you |
|---|---|
| Right after a rebirth | The baseline for the new cycle |
| Midpoint of the cycle | Whether income is on pace |
| Just before the next rebirth | The peak you are trading away |
| After a patch | Whether balance changes moved your numbers |
Four rows per cycle give a usable history without turning logging into a chore. A player who completes ten cycles has forty rows, enough to see a trend.
Patch days deserve a note. Balance changes alter what a given upgrade is worth, so a drop or jump in credits per second right after an update is not a result of your play. Our Droid Tycoon 1.34.0 notes show the kind of change worth flagging in the note column.
Step by step: from the Player Stats screen to a saved CSV
- Open the Player Stats screen in Droid Tycoon at your chosen moment.
- Create a new sheet in Excel or Google Sheets and paste the header row from above, one value per column.
- Enter the timestamp, then each stat from the screen in column order.
- Convert time played to decimal hours before you move on.
- Repeat at each fixed moment. Keep the same sheet open across sessions so rows stay in order.
- Save a copy as CSV. In Excel, choose File, then Save As, then CSV (Comma delimited) (*.csv). In Google Sheets, choose File, then Download, then Comma-separated values (.csv).
- Name the file with the account and the year, for example
droid-tycoon-main-2026.csv.
Keep the working sheet in its native format and treat the CSV as the export copy. A CSV stores values only, so formulas, charts and formatting are lost on save. If you save the CSV and keep editing it, you lose your charts the next time you close the file.
Where the file goes
The file lands in whichever folder you choose in the save dialog. Pick one folder for all exports and back it up. A cloud-synced folder protects the file when you switch machines.
Open and use the CSV to compare progress
A CSV earns its place when you ask questions of it. Four calculations cover most of what a tracker needs.

Income per cycle
Filter the rows to the first snapshot after each rebirth and chart credits per second against the rebirth count. A rising line means each cycle starts stronger. A flat line means upgrades are not carrying over into the baseline, which is a signal to review your planning.
Income per hour played
Subtract time played at the start of a cycle from time played at the end. That gives the hours the cycle took. Dividing the credits-per-second gain by those hours shows how efficiently a cycle used your play time. Compare cycles with the same length of play, because a short cycle and a long cycle are not directly comparable.

Crit chance against income
Plot crit chance next to credits per second. If crit chance rises and income does not, the upgrades you bought for crit are not the ones moving income, and the next purchase should change.
Crafting pattern
Count how often each droid appears in the most crafted column. A droid that stays at the top for many cycles marks your loop. A change in that column after a patch shows that the loop shifted.
A worked example
The values below are illustrative, not real player data. Suppose your file holds two post-rebirth rows:
| timestamp | rebirths | credits_per_second | time_played_hours |
|---|---|---|---|
| 2026-11-01 18:00 | 4 | 1200 | 20.0 |
| 2026-11-08 18:00 | 5 | 1500 | 31.5 |
The cycle took 11.5 hours of play (31.5 minus 20.0) and raised the baseline by 300 credits per second, about 26 per hour played. If your next cycle raises the baseline by 300 in 8 hours, that is about 37.5 per hour, a clear improvement worth repeating.
Problems with a CSV file and how to fix them
| Symptom | Likely cause | Fix |
|---|---|---|
| All values sit in one column | The tool expects a different delimiter | Use the import option and choose comma as the delimiter |
| Rows are out of order | Timestamps saved as text in mixed formats | Rewrite them as year-month-day with 24-hour time |
| Numbers read as text | A percent sign or unit sits inside the cell | Keep the cell numeric and move the unit into the header |
| A value splits into two columns | A thousands separator inside the cell | Remove separators from the raw value |
| Special characters look broken | Encoding mismatch | Save as CSV UTF-8 if your tool offers it |
| Charts vanished | The CSV was edited instead of the working sheet | Rebuild the chart from the native sheet, then export a new copy |
If rows are missing, the cause is almost always a skipped snapshot, not a file fault. A gap in the timestamps shows it. Fill the gap with a note and leave the numbers empty, since an empty cell is more honest than an estimate.
Perspective
We built Droidex Companion around one observation: players lose the most information at the moment they need it. A rebirth decision depends on numbers from the last cycle, and those numbers are gone once the reset happens.
That is why a CSV log is worth keeping, and why the effort of keeping it should be low. Droidex Companion uses local screen recognition to read your stats live, so the values you work with come directly from what the game displays. The same approach powers rebirth planning, collection management and customizable overlays, with all main features free.
Our advice is to combine both: let the companion show the live picture while you play, and keep a short spreadsheet history so that you can compare cycles. Players who track rebirth after rebirth tend to plan better, because every decision rests on their own data.
Daniel
Pair the file with live tracking
A spreadsheet shows what happened. Live tracking shows what is happening. Our guide to recording four Droid Tycoon stats explains which readings to capture in a cycle, and the progress tracker guide shows how a live companion fits into rebirth planning.
For collections, a separate sheet works better than extra columns. The six-column collection tracker avoids failed rebirths by listing which droids you still need. Keep it as its own CSV so the stats file stays narrow.
Once you have a few cycles of data, use it to decide when to reset. The rank 12 super rebirth guide and the comparison of rebirth against grinding both give the rank checks that your income-per-cycle chart can confirm.
Droidex Companion for your stat log
Droidex Companion is a free Windows app for Droid Tycoon players. It tracks live in-game stats through local screen recognition, supports rebirth planning and collection management, and offers customizable overlays, leaderboards, calculators and update guides. You can read a value on screen while you play and enter it in your sheet at the next snapshot moment. Download Droidex Companion to start.
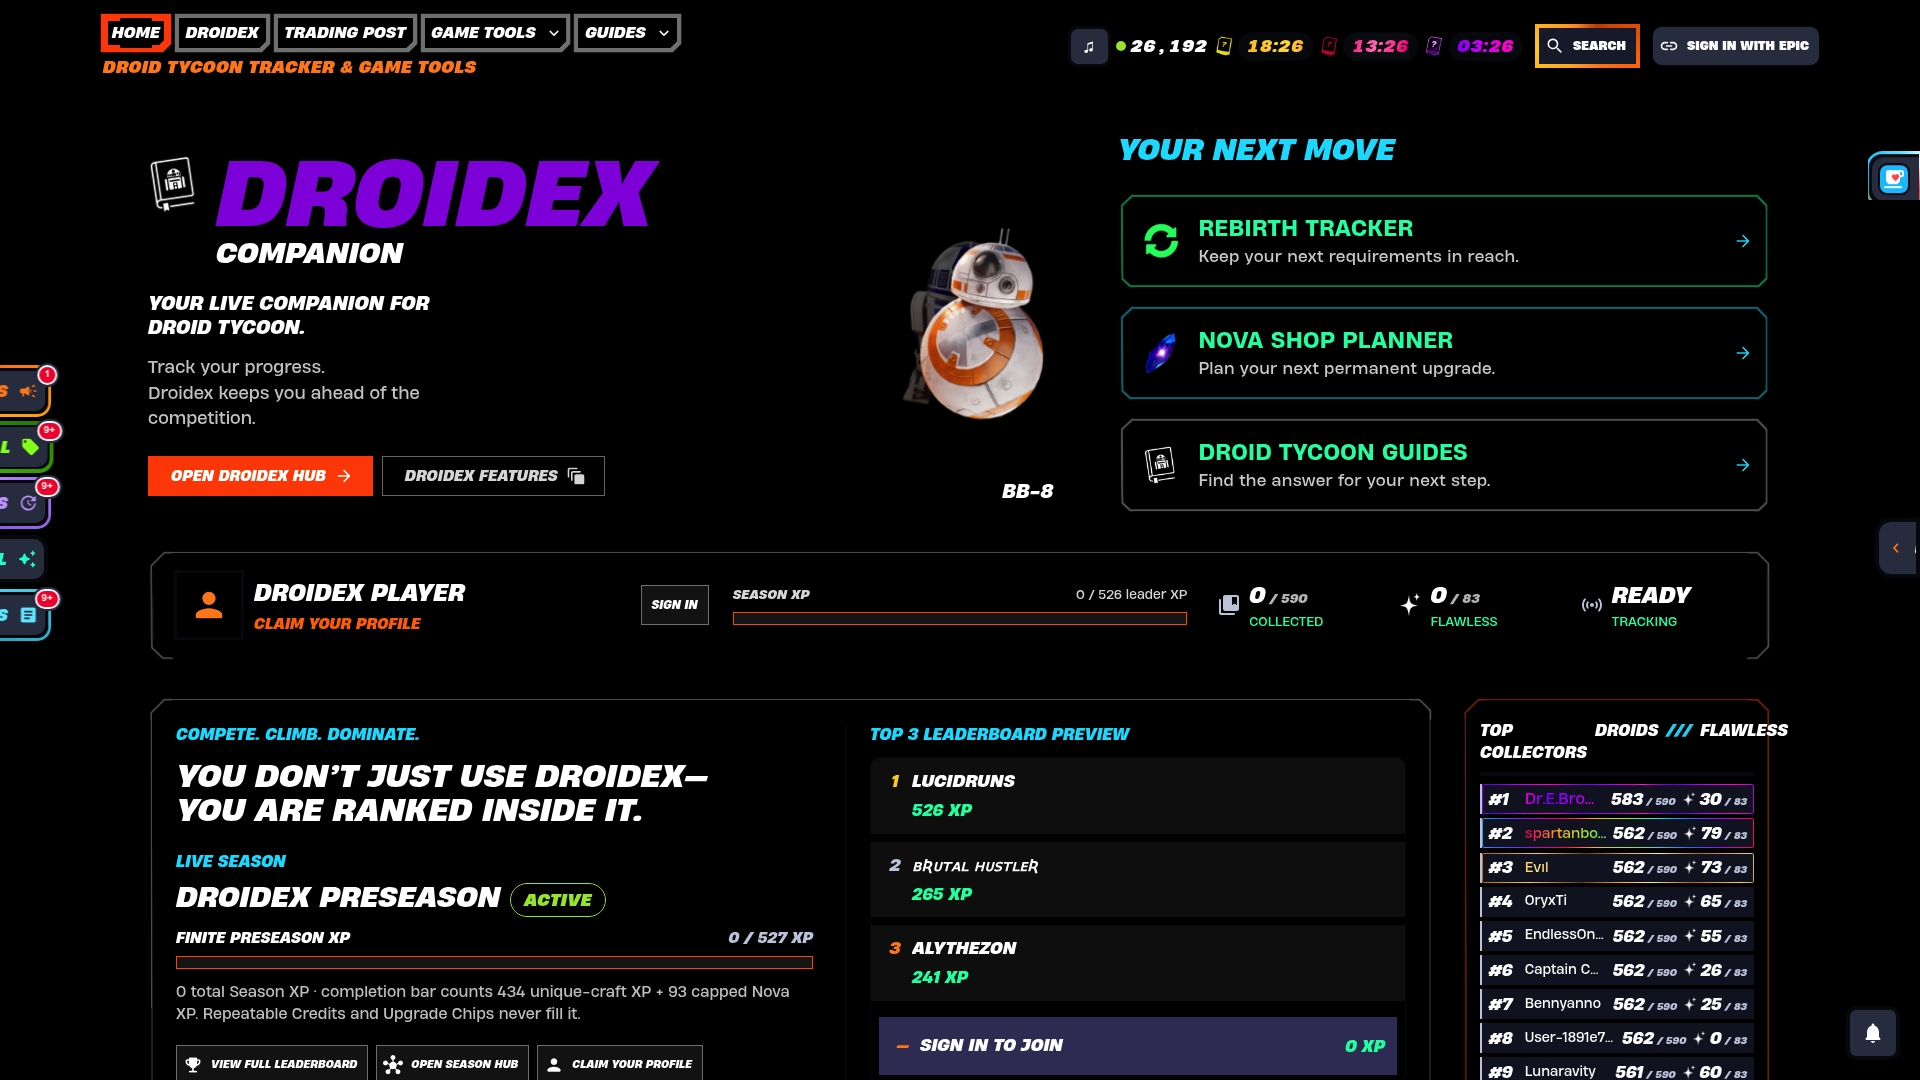
The rebirth cycles tracker lists requirements per cycle, which makes a good reference when you fill the note column. The 5 minute setup guide walks through installing the app and setting up a performance dashboard.
Keep the log accurate over time
A log is only as good as its routine. A few habits keep it usable for months:
- Snapshot at the same screen state every time, with no menus open and no mid-craft actions.
- Log before you rebirth, never after. The pre-reset values are the ones that disappear.
- Record one account per file. Mixed accounts break every average.
- Archive the CSV at the start of each season and begin a new file with the same header.
AFK sessions need their own treatment. Time played keeps counting while you are away, which inflates hours and lowers your income per hour. Mark those sessions in the note column. Our AFK tracking guide covers which droids to check before a rebirth after an idle stretch.
FAQ
Does Droid Tycoon have an export button for stats?
The Player Stats screen displays your figures, and this guide builds the CSV from that screen. The workflow works on any account and needs only a spreadsheet. If you want live values while you play, Droidex Companion reads them from the screen locally.
Which stats should I put in the CSV?
Start with rebirths, credits per second, crit chance, time played and most crafted droid, plus a timestamp and a note column. These match the fields shown on the Player Stats screen. Add more columns only when a question needs them.
How often should I log a row?
Log at four fixed points per rebirth cycle: right after a rebirth, at the midpoint, just before the next rebirth and after each patch. This gives you comparable rows without constant interruptions. Skipped snapshots are better left as gaps than filled with estimates.
Why does my CSV open in one column?
The tool expected a different delimiter, such as a semicolon, which some regional settings use. Use the import dialog and select comma. Then check that no cell contains a comma of its own, such as a thousands separator.