

Screen recognition uses CPU time every time it reads a frame, and the load scales with how much of the screen is read and how often. A small, well-placed region sampled a few times per second costs far less than a full-screen read at your monitor's refresh rate. You control both variables, so recognition CPU usage is a setting you tune, not a fixed cost.
This guide explains where the load comes from, what published measurements show, how to measure it on Windows, and which Droidex Companion settings keep it low during Droid Tycoon sessions.
TL;DR
- Recognition load depends on region size, read frequency, resolution and the number of monitors.
- Reading small regions instead of the full screen is the largest single reduction.
- Windows Task Manager shows per-process CPU live; Windows Performance Analyzer shows it per thread over time.
- Droidex Companion runs recognition locally on your PC, so the settings on your machine decide the load.
Table of Contents
- Does local screen recognition use CPU while a game runs?
- What published measurements say about the load
- CPU, GPU or both?
- How to measure recognition CPU usage in real time
- Can recognition CPU usage affect game performance?
- How to lower recognition CPU load and keep the data
- A sample tuning pass
- Perspective
- Put recognition to work in Droid Tycoon
- Accuracy and load pull in different directions
- FAQ
- Sources
Does local screen recognition use CPU while a game runs?
Yes. Local recognition means the work happens on your own processor instead of a remote server. Each captured frame region is converted, cleaned up, and passed to a text or image recognizer, and that processing needs CPU cycles. Nothing is offloaded, so your hardware is the processing backend.
The benefit of this design is control. No upload is needed, latency stays low, and the tracking works with live in-game numbers. Droidex Companion is built on local screen recognition for this reason: stats such as rebirth progress and collection values update while you play. The trade is that you set the load level, and the sections below show how.
A second point matters for games: the game and the recognizer compete for the same cores only when the game is CPU-bound. Many titles are limited by the graphics card instead, which leaves CPU headroom. If your game is CPU-bound, recognition settings matter more.
What published measurements say about the load
No single number applies to every setup, because the work depends on the input. Three public data points show the range and the reasons.
Resolution drives time per read. An ACM paper on OCR-based widget localization reports that recognizing text on a 2k-resolution screen with Tesseract often takes over 2 seconds on a normal laptop with an Intel i7 CPU, and that the time rises to 3 to 5 seconds at 4k. The same paper reports that its localization method keeps the time under 0.5 seconds in over about 60% of cases without GPU support. The lesson is that the amount of image handed to the recognizer matters more than the recognizer itself.

Continuous reading multiplies the load. A company write-up on a continuous screen-capture tool describes a user who measured over 100% CPU and more than 10 GB of RAM. The same page explains the cause: the load is workload-dependent, and extra monitors multiply the frame count, high frame rates multiply it again, and a debug build adds overhead. That tool reads whole screens continuously and writes every frame to a database. A tracker that reads a few small regions does a fraction of that work.
Region size and frequency are the levers. Across these sources the pattern is the same: cost is roughly the pixels read times the reads per second. Cutting either one cuts the load in proportion.
| Factor | Raises CPU load | Lowers CPU load |
|---|---|---|
| Region size | Full screen or large boxes | Tight boxes around single stats |
| Read frequency | Every frame | A few reads per second |
| Resolution | 4k capture | 1080p or scaled capture |
| Monitors | Several monitors read at once | Only the game window read |
| Build type | Debug or unoptimized builds | Release builds |
| Image cleanup | Heavy filtering on large areas | Light filtering on small areas |
CPU, GPU or both?
Recognition models can run on the CPU, on the GPU or on a dedicated accelerator, depending on the library and the hardware. The ACM paper notes that even with GPU acceleration, running PaddleOCR on a 4k screenshot still often costs nearly 1.5 seconds, so moving work to a GPU does not remove the cost of large inputs.
For a gamer, the GPU is usually the busier component already. Sending recognition work there can take frames away from the game, while CPU-side recognition often uses cores the game leaves idle. Which is better depends on whether your game is limited by the CPU or the GPU. Windows Performance Analyzer reports both: it provides CPU Usage graphs by process, thread and activity, plus GPU Utilization by process. Read both graphs before deciding where the pressure sits.
How to measure recognition CPU usage in real time
Measure before changing anything, so each change has a visible result.
Quick check with Task Manager
Microsoft's guidance for finding the process behind high CPU is to open Task Manager and view CPU consumption by process. On a gaming PC:
- Start Droid Tycoon and Droidex Companion as you normally would.
- Open Task Manager with Ctrl+Shift+Esc and select the Processes tab.
- Sort by CPU and note the Droidex Companion row while you play for one to two minutes.
- Note the game's row and the total CPU figure at the top.
- Repeat after each setting change and compare against the first reading.
Use the same in-game activity for every reading. A menu screen and a busy base produce different numbers.
Deeper check with Windows Performance Analyzer
When Task Manager shows spikes, Windows Performance Analyzer breaks CPU use down by thread, so you can see whether spikes line up with recognition reads. It has a steeper learning curve, but it answers the question "does the load come in bursts or stay flat?".
Sampling during play
Performance tools built for games sample at set intervals. GameBench documentation says its metrics can be sampled every second or every few seconds, covering FPS, CPU, GPU, RAM, power and network usage, and it warns that thermal throttling can materially affect app performance. The same caution applies at your desk: run each measurement after the PC has warmed up, or a cold start will flatter the numbers.
For frame-level effects of overlays and recognition on FPS, our walkthrough on how to find which overlay feature costs FPS gives six separate tests.
Can recognition CPU usage affect game performance?
It can, when the total CPU demand reaches the limit of the cores your game uses. Symptoms are frame time spikes, not a lower average. Watch for a drop in the 1% low frame rate rather than the average FPS figure.
Three conditions make it likelier: a CPU-bound game, a low core count, and a recognizer set to read large areas many times per second. Each is adjustable except the hardware. In Droid Tycoon, the stats you track change slowly compared with the frame rate. Rebirth progress, currency totals and collection values do not need a 60-times-per-second refresh, so a modest read rate captures them without loss.
Competitive play adds a second consideration: consistency. A steady, low background load is better than a mean that looks small but spikes. Check for spikes using the per-thread view described above.
Windows settings can shift frame behavior as well. Our PresentMon guide on fullscreen optimizations shows how to test one such setting with your own numbers.
How to lower recognition CPU load and keep the data
The aim is fewer pixels read fewer times, with no loss of the values you act on.
1. Shrink the recognition regions
The largest saving comes from tight boxes around each stat. A box that covers a whole HUD panel makes the recognizer process labels, icons and empty space. A box around a single number processes only the number. Droidex Companion uses labeled boxes for each stat, and the guide on recognition region setup explains how to place them by label instead of by coordinates.
2. Track only the stats you use
Each tracked stat is one more region to read. If you plan rebirths, keep the rebirth and currency regions active. If you manage collections, keep those. Turn off the rest while they are not needed. The rebirth cycles tracker shows which values a rebirth plan depends on, which helps decide what to keep.
3. Skip unchanged frames
When the screen has not changed, a read adds nothing. Comparing a region with its previous state and skipping duplicates is a standard technique in continuous capture tools; a DEV Community article describes frame diffing to skip duplicate screenshots and batched processing during idle periods as ways such tools reduce spikes. The principle carries over to any recognition setup: stable numbers need fewer reads.
4. Capture at a sensible resolution
Because time per read grows with pixel count, a game at 1440p or 4k hands the recognizer more pixels than a 1080p game. Small regions keep this effect minor. Large regions at high resolution are where cost grows fastest.
5. Keep the text clean at the source
Blurry or poorly filtered text forces extra processing or repeated reads. If overlay or in-game text looks soft, see how to find the cause of blurry overlay text. Anti-aliased edges also matter during image cleanup: keeping grayscale until binarization preserves detail that recognition needs, which reduces failed reads.
6. Read the game window only
Every additional monitor read adds to the frame count. Limit capture to the monitor that shows Droid Tycoon.
7. Keep the overlay light
Overlay drawing is separate from recognition but shares the same machine. A compact layout draws less. The overlay setup guide for stable FPS covers layout choices that keep frame rate steady.
A sample tuning pass
The values below are an illustration of the method, not measurements of Droidex Companion. Replace them with your own readings.
| Step | Change | What to record |
|---|---|---|
| 0 | Baseline with default regions | Task Manager CPU for the app and the game, 1% low FPS |
| 1 | Shrink boxes to single values | Same metrics, same in-game activity |
| 2 | Disable unused stat regions | Same metrics |
| 3 | Limit capture to the game monitor | Same metrics |
| 4 | Re-enable a stat only if you miss it | Same metrics |
Stop when the game's 1% low frame rate matches what you see with the app closed. Further cuts then only reduce tracking detail.
Perspective
We built Droidex Companion around local screen recognition because live tracking should not depend on a server or on guesswork. The tradeoff is real in any local system: the work runs on your PC, so the design has to respect your frame budget.
That is why we treat regions as the core of the setup. A tracker that reads exactly the numbers a rebirth plan needs does far less work than one that reads everything. Droid Tycoon stats change in steps, not every frame, so precise regions give you current values with a small footprint.
Our advice is to place boxes carefully once, keep only the stats you use, and let the overlay, calculators and leaderboard work from clean data. All main features stay free, so you can configure the tracker around your own hardware without a paywall deciding what you can read.
Daniel
Put recognition to work in Droid Tycoon
Droidex Companion is a free Windows app for Droid Tycoon players. It tracks live stats through local screen recognition, supports rebirth planning and collection management, and offers customizable overlays, calculators, update guides and leaderboards. You decide which regions it reads, which keeps the load matched to your PC.
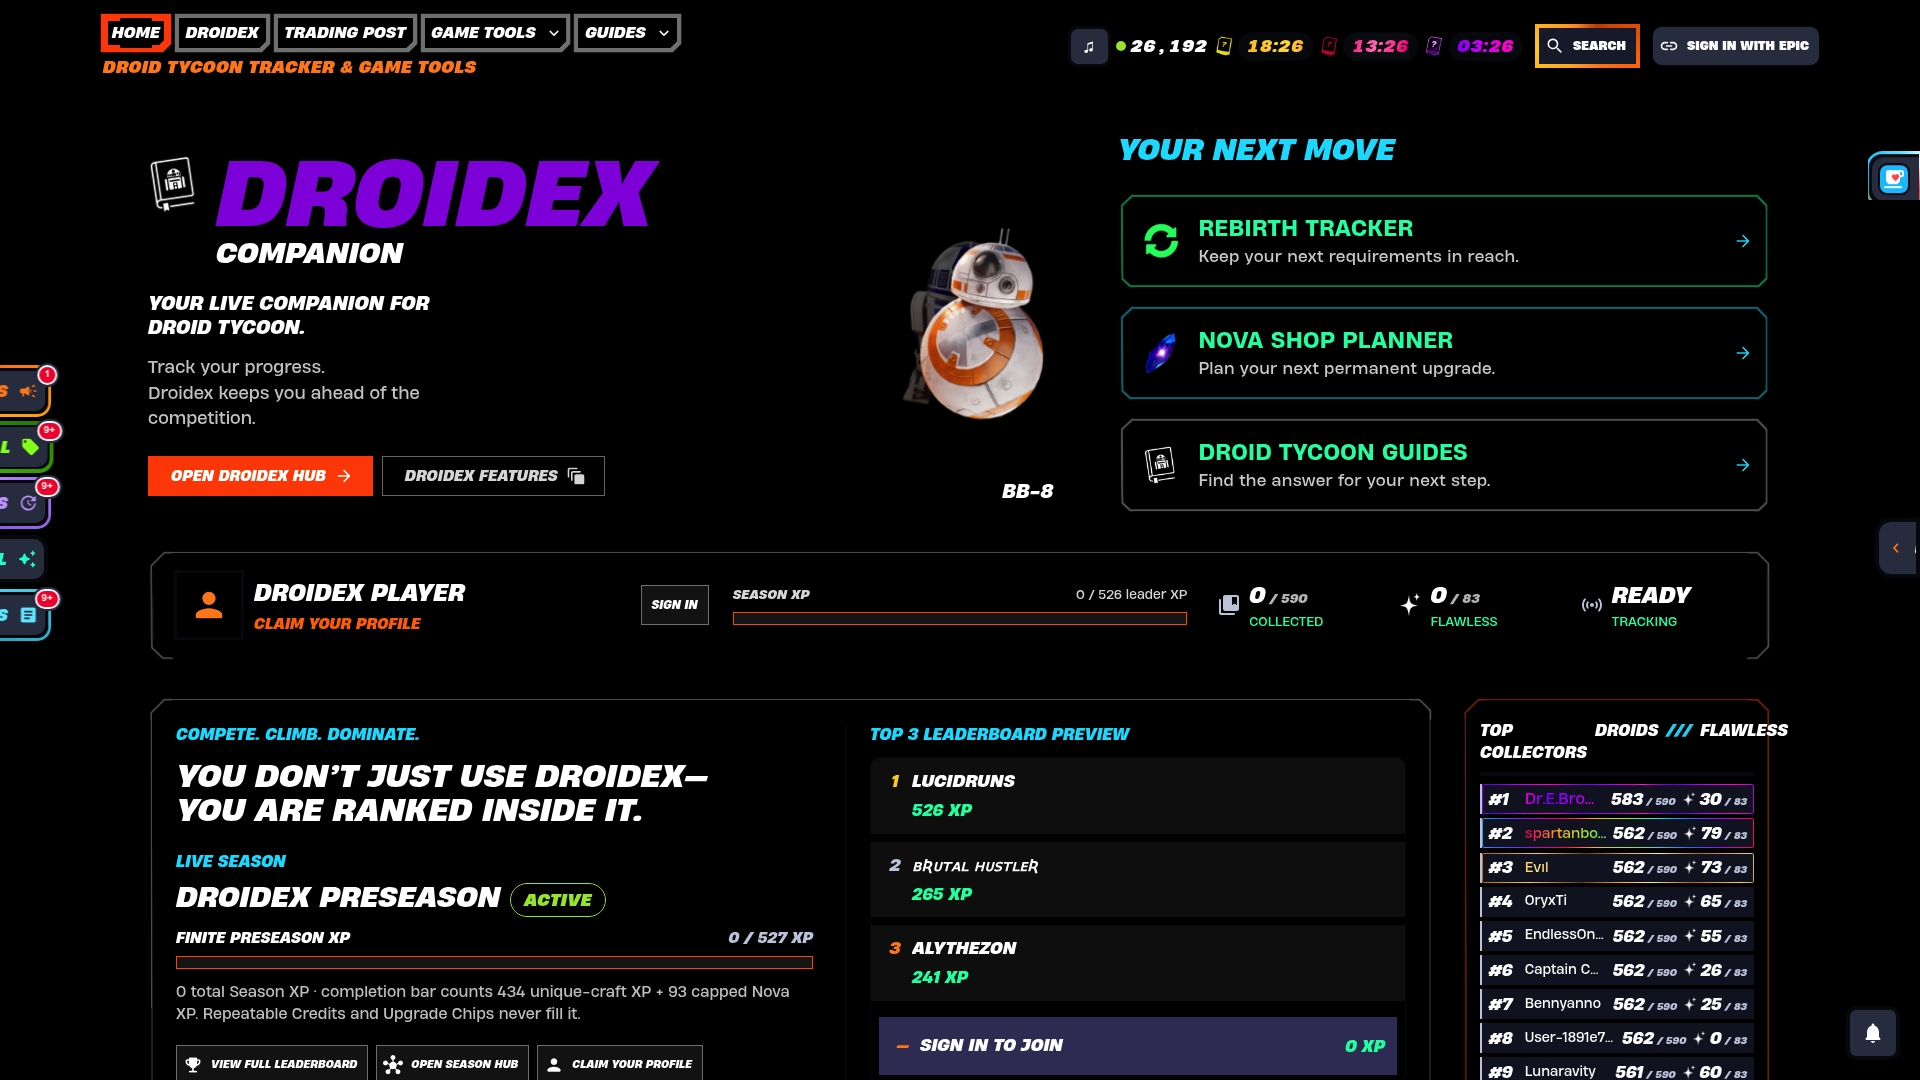
Start with the Droidex Companion download page, then follow the 5 minute setup for the performance tracking dashboard. Players who compare their numbers with others can view the community statistics.
Accuracy and load pull in different directions
Lowering the read rate or region size can reduce how often a value updates. For a slowly changing stat, that costs nothing. For a fast-moving value, you may see a short lag. The right balance depends on what you do with the value. A rebirth requirement checked once a minute needs a low rate. A live counter you watch during a rush may justify a higher one.
Accuracy is a separate question from speed. If you want to know how to think about the error of any tracking system, the article on stat tracking accuracy explains how to read tolerances. Pair that with an overlay that stays readable, and the screen recognition overlay for rebirth planning shows how the pieces fit in a normal session.
If hotkeys let you toggle the overlay or pause reads during menus, you can cut idle reads further. The overlay hotkeys guide lists the Windows key combinations and the steps to fix conflicts.

FAQ
How much CPU does screen recognition use?
It depends on region size, read rate, resolution and monitor count. Published examples range from short reads on small images to loads above 100% for tools that read every frame of whole screens continuously. Measure your own system in Task Manager with the same in-game activity before and after each change.
Does recognition use the CPU or the GPU?
That depends on the library and hardware. Many setups use the CPU, and some can use the GPU or an accelerator. Because a game often loads the GPU heavily, CPU-side recognition on small regions is commonly a good fit. Windows Performance Analyzer shows both CPU and GPU use by process.
Will recognition lower my FPS in Droid Tycoon?
Only if the total CPU demand reaches the limit of the cores your game uses. The visible sign is a drop in 1% low frame rate, not the average. Smaller regions and fewer tracked stats reduce that risk.
What is the quickest way to cut recognition load?
Shrink each recognition box to the single value you need, and turn off stats you are not using. These two changes reduce pixels read and reads per second, which are the two main drivers of cost.
Sources
- Accelerating OCR-Based Widget Localization for Test Automation of GUI Applications (ACM)
- Fix: Screenpipe High CPU Usage on Mac (LUCI)
- List of WPA Graphs (Microsoft Learn)
- High CPU usage troubleshooting guidance (Microsoft Learn)
- Data documentation (GameBench)
- Screenpipe's Local Recording Loop (DEV Community)